The IndyMed Preparedness Initiative:
A roadmap from Corona, Long COVID, Post-Vac to Chronic Fatigue Syndrome
and P4 Family Medicine
Figures and extended legends
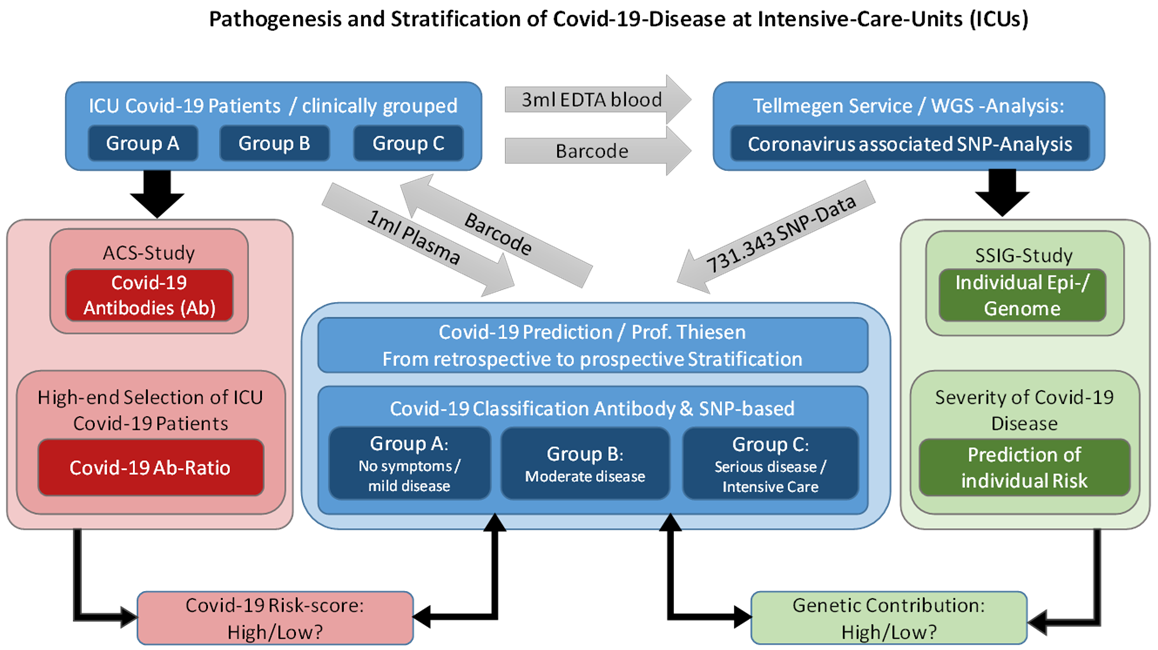 Figure 1
Pathogenesis and stratification of Covid-19-diseases at
Intensive-Care-Units. The cartoon illustrates how in pandemic times
direct to consumer (DTC) genetic testing was supposed to be combined
with Corona antibody diagnostics. In the forthcoming future, the
roadmap might be the following: DTC genetic testing services are
ordered by individual customers, clinical and antibody testing are
assumed to be performed in concert with associated Family Physician.
Figure 1
Pathogenesis and stratification of Covid-19-diseases at
Intensive-Care-Units. The cartoon illustrates how in pandemic times
direct to consumer (DTC) genetic testing was supposed to be combined
with Corona antibody diagnostics. In the forthcoming future, the
roadmap might be the following: DTC genetic testing services are
ordered by individual customers, clinical and antibody testing are
assumed to be performed in concert with associated Family Physician.
The extended computational data analysis of SNP and clinical data is
scheduled to be conducted by trained bioinformatic expert teams that
compute the most informative SNP panels with the final directive to
store Corona /disease related SNP data on personal health records of
the customers.
IndyMed aims to conduct a pilot study together with DTC service
providers by offering this research and development (R&D) scheme to
individuals that suffer from ME/CFS besides studies with focus on
osteoarthritis, rheumatoid arthritis and multiple sclerosis.
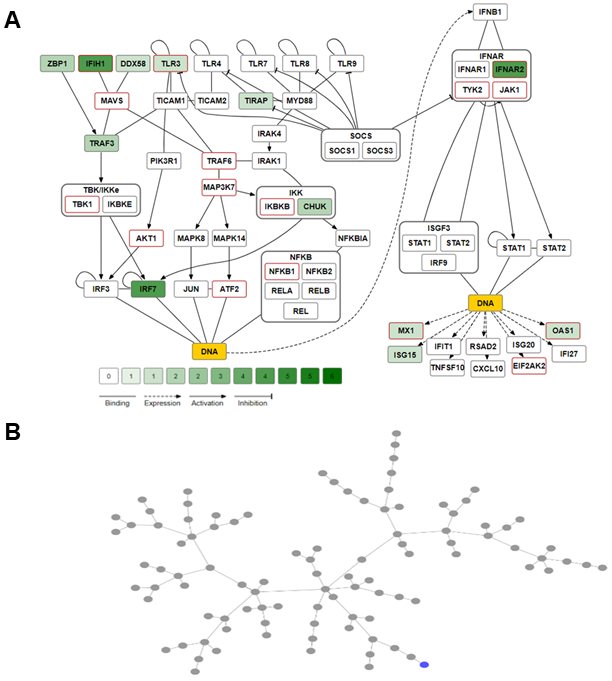 Figure 2
Animated Interferon-beta-related signal transduction pathway [Hundeshagen et al. 2012; Fairley et al. 2019].
Figure 2
Animated Interferon-beta-related signal transduction pathway [Hundeshagen et al. 2012; Fairley et al. 2019].
Please find the animation here: Interferon Pathway visualisation of SNPs
A Nonsynonymous coding SNPs of genes representing the Interferon
signal pathway were counted to determine and illustrate SNP related
complexities found between protein sequences derived from different
personal genomes. The color coding (green shades) discloses how many
different coding SNPs have been detected per protein and individual
genome. The speed of the animation, meaning how many genomes shall be
displayed consecutively to visualize the interplay of differences in
polymorphic signal transduction between individuals can be manually
assessed, as well the animation can be stop at any time. The SNP count
is shown for one individuum (NA12045), see NA12045 in Figure 10 being
link with ICU_44A4.
B Minimum spanning trees were calculated based on the number of
SNPs in coding exons of 503 Caucasians provided by the 1000 genome
project. The individual genome NA12045 is marked blue. The node
relationship indicates how similar or dissimilar the individual´s
coding SNPs are compared to the population.
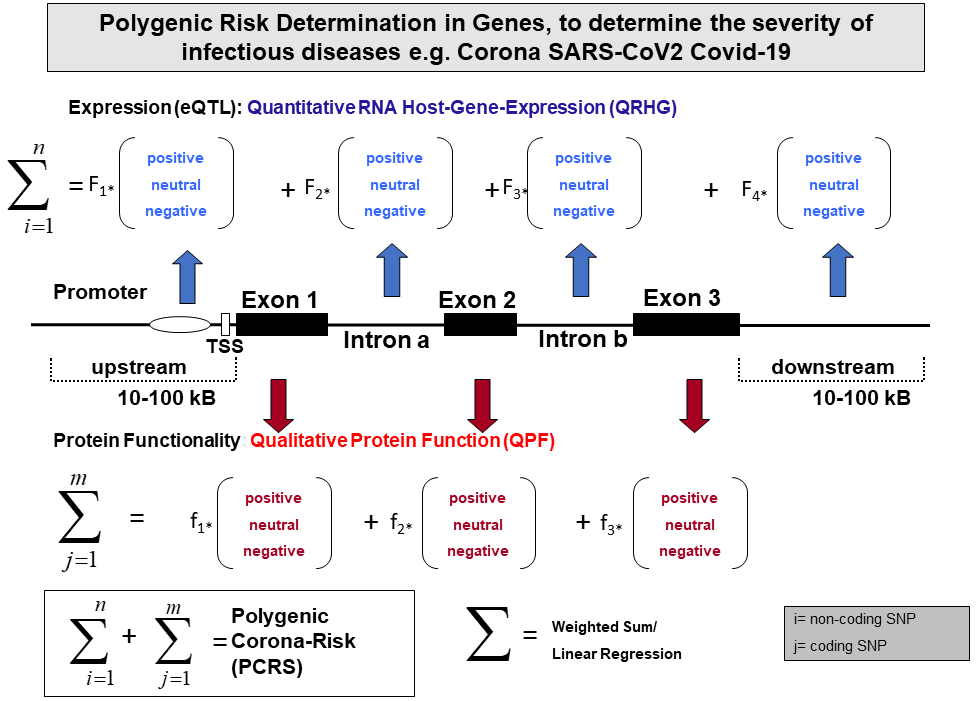 Figure 3
Polygenic risk determination in genes, to determine the severity of
infectious diseases e.g. SARS-CoV2 Covid19. The gene structure has been
illustrated by upstream and downstream regions, 3 exonic and 2 intronic
regions. Each SNP might be presented homozygous to be a disease SNP or
a SNP being protective. The weighted factors F1-Fn on the RNA level
(DNA based) and f1-fn on the protein level (Protein-based) are the
crucial factors to determine the validity of personal risk score
analysis. The formula PCRS is expected to be universally applicable.
The IndyMed initiative plans to be implemented in an AI driven
knowledge based expert system.
Figure 3
Polygenic risk determination in genes, to determine the severity of
infectious diseases e.g. SARS-CoV2 Covid19. The gene structure has been
illustrated by upstream and downstream regions, 3 exonic and 2 intronic
regions. Each SNP might be presented homozygous to be a disease SNP or
a SNP being protective. The weighted factors F1-Fn on the RNA level
(DNA based) and f1-fn on the protein level (Protein-based) are the
crucial factors to determine the validity of personal risk score
analysis. The formula PCRS is expected to be universally applicable.
The IndyMed initiative plans to be implemented in an AI driven
knowledge based expert system.
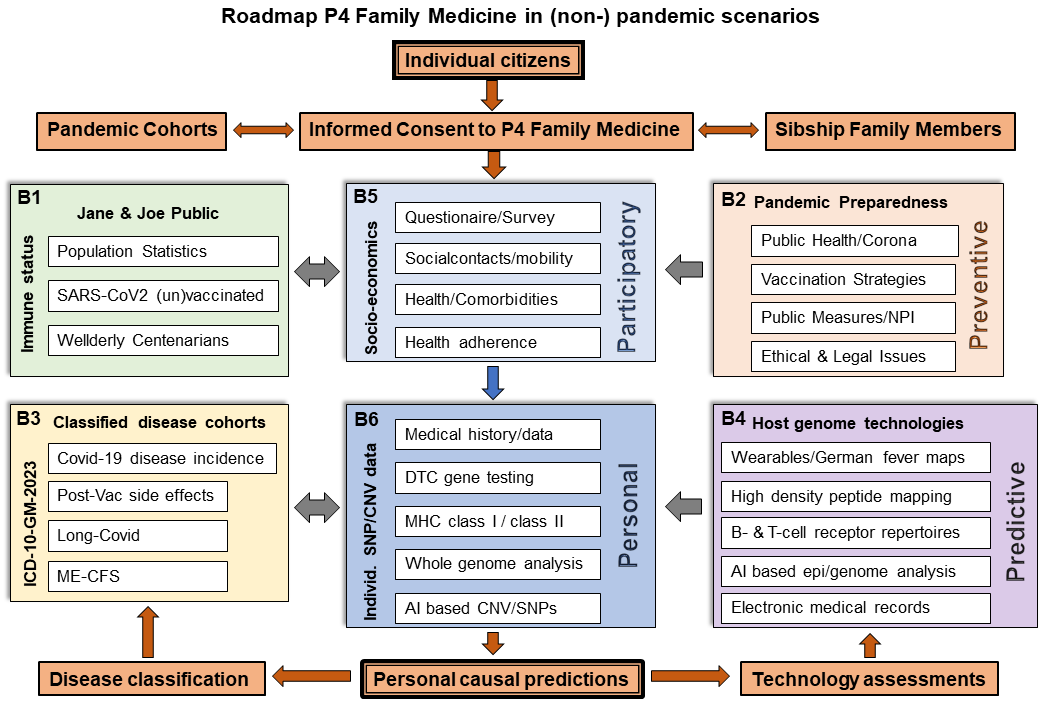 Figure 4
Roadmap P4 Family Medicine in (non-) pandemic scenarios. Personal
assessments of individuals regarding the 4 Ps coined participatory
(B5), personal (B6), predictive (B4) and preventive(B2) are compared to
immune status of Jane & Joe Public and one’s own health by making use
of the ICD10 classification. Though this illustration is being focused
on Corona, the same P4 schedule can be applied for the assessment of
any other infection or comorbidity. Strategic highlights are the
integration of in-house knowledge on whole genome/medical history data
of Wellderly /Centenarians (B1), the usage of wearables in assessing
longitudinal data (e.g. physical activity, body temperature) or the
integration of density peptide mapping studies and/or B-cell receptor
and T-cell receptor sequencing data.
Figure 4
Roadmap P4 Family Medicine in (non-) pandemic scenarios. Personal
assessments of individuals regarding the 4 Ps coined participatory
(B5), personal (B6), predictive (B4) and preventive(B2) are compared to
immune status of Jane & Joe Public and one’s own health by making use
of the ICD10 classification. Though this illustration is being focused
on Corona, the same P4 schedule can be applied for the assessment of
any other infection or comorbidity. Strategic highlights are the
integration of in-house knowledge on whole genome/medical history data
of Wellderly /Centenarians (B1), the usage of wearables in assessing
longitudinal data (e.g. physical activity, body temperature) or the
integration of density peptide mapping studies and/or B-cell receptor
and T-cell receptor sequencing data.
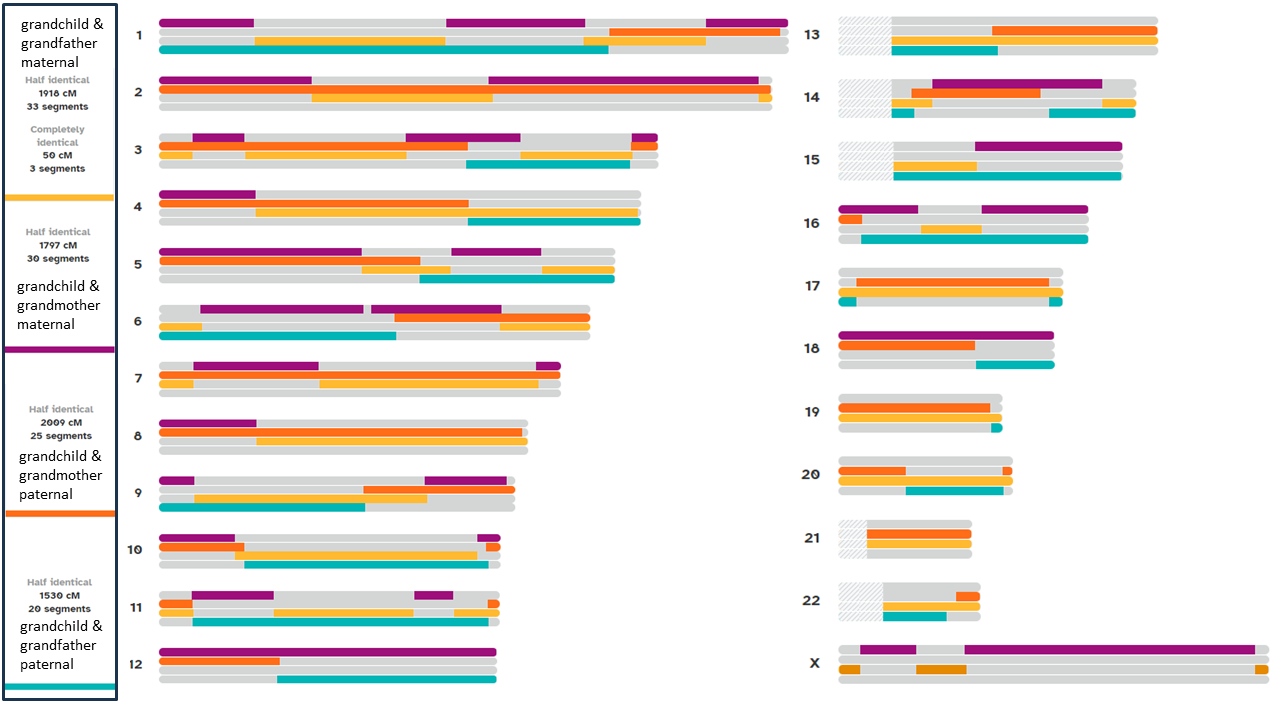 Figure 5
Transgenerational Medicine: Graphical representation of chromosomal
heterozygosity by comparing the genome of a grandchild with the genomes
of his maternal and paternal grandparents broken down to 23 chromosomes
(numbers 1-22 and X-chromosome) based on Direct-to-Consumer-Services
(23andMe). The different colors indicate shared DNA segments for
grandchild and grandfather maternal (yellow), grandchild and
grandmother maternal (purple), grandchild and grandmother paternal
(orange), and grandchild and grandfather paternal (light blue). Numbers
of half identical as well as complete identical DNA segments are given
at the left for each combination.
Figure 5
Transgenerational Medicine: Graphical representation of chromosomal
heterozygosity by comparing the genome of a grandchild with the genomes
of his maternal and paternal grandparents broken down to 23 chromosomes
(numbers 1-22 and X-chromosome) based on Direct-to-Consumer-Services
(23andMe). The different colors indicate shared DNA segments for
grandchild and grandfather maternal (yellow), grandchild and
grandmother maternal (purple), grandchild and grandmother paternal
(orange), and grandchild and grandfather paternal (light blue). Numbers
of half identical as well as complete identical DNA segments are given
at the left for each combination.
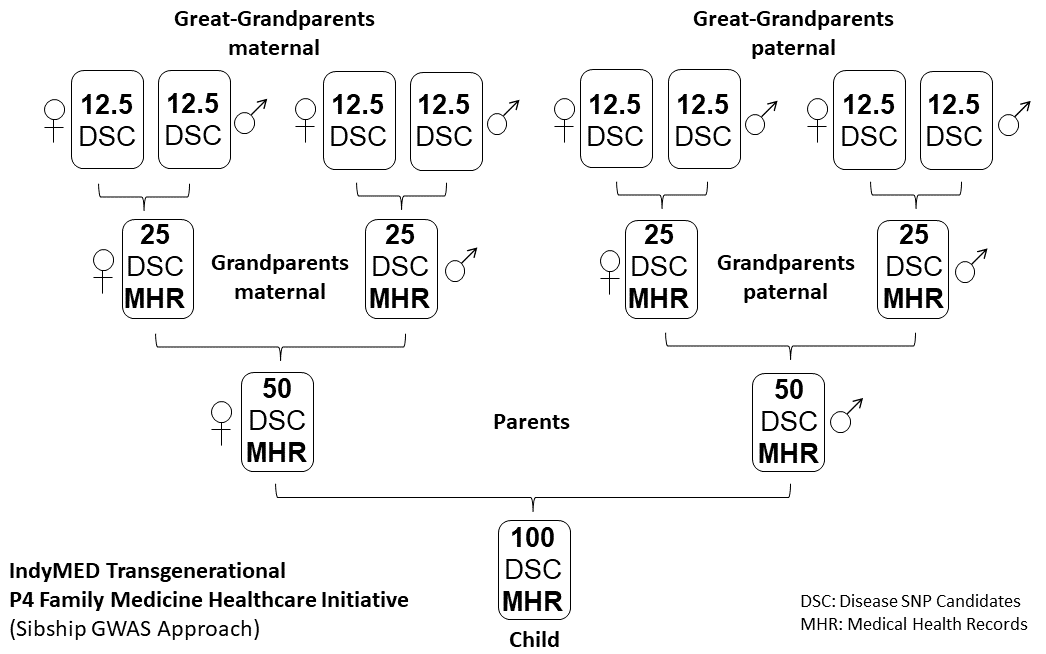 Figure 6
IndyMed Transgenerational P4 Family Medicine healthcare initiative (SNP
lineal family based GWAS approach). Inherited transgenerational traits
within blood related family members are illustrated by showing the
genetic inheritance of polygenic diseases (Disease SNP Candidate (DSC))
over 3 generations from Great-Grandparents maternal and paternal to
their Great-Grandparents-Child (see also Figure 5). As long dominant
and recessive Mendelian gene defects are traced, a simple PCR-sequence
analysis will be sufficient. Note, P4 Family Medicine projects deal
with the identification of polygenic disease marker and the
stratification of predictive SNPs followed by a prevention strategy.
Figure 6
IndyMed Transgenerational P4 Family Medicine healthcare initiative (SNP
lineal family based GWAS approach). Inherited transgenerational traits
within blood related family members are illustrated by showing the
genetic inheritance of polygenic diseases (Disease SNP Candidate (DSC))
over 3 generations from Great-Grandparents maternal and paternal to
their Great-Grandparents-Child (see also Figure 5). As long dominant
and recessive Mendelian gene defects are traced, a simple PCR-sequence
analysis will be sufficient. Note, P4 Family Medicine projects deal
with the identification of polygenic disease marker and the
stratification of predictive SNPs followed by a prevention strategy.
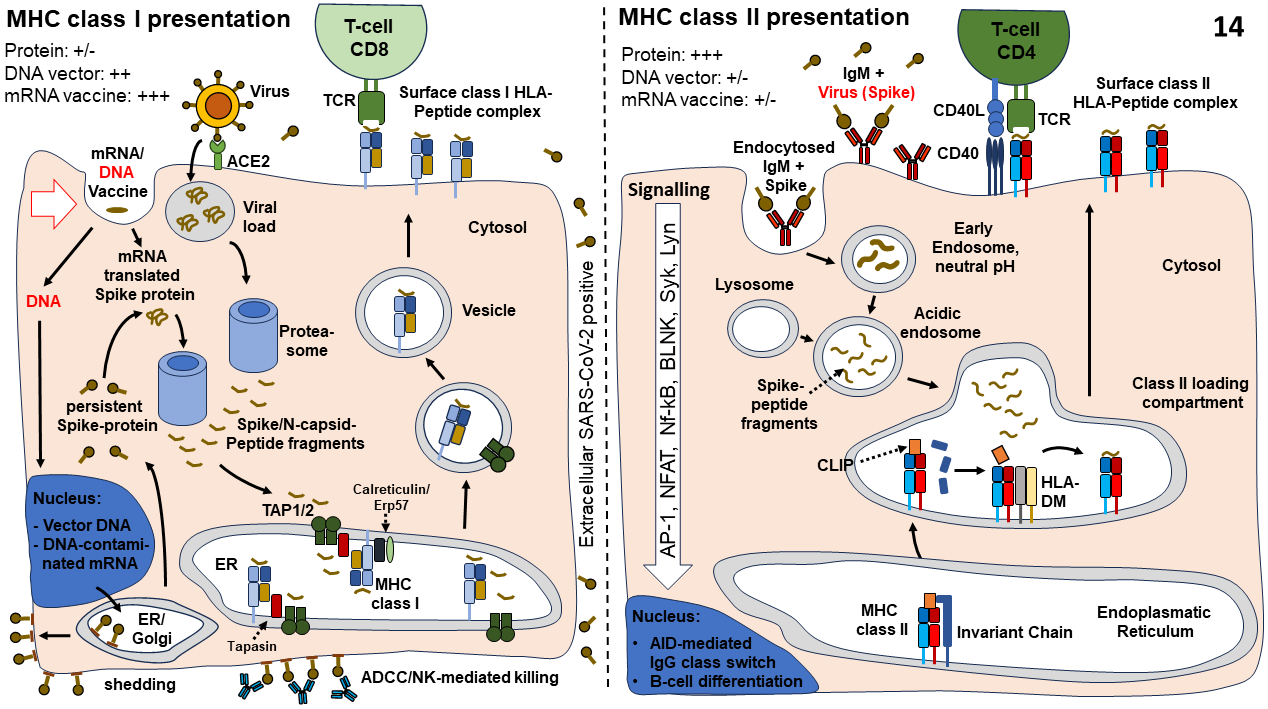 Figure 7
MHC class I peptide antigen presentation illustrated on the left: MHC
class I peptide presentation to CD8 positive cytotoxic T-cells. Note,
Corona viruses are taken up by ACE2 positive cells, adenoviruses by CAR
and LNP mRNA vaccines by apolipoprotein E. Note, peptides presented by
MHC class I complexes are of cytosolic origin. Adenoviral DNA will end
up in the nucleus. Possibly, DNA fragments of DNA contaminated mRNA
vaccines might enter the nucleus of dividing cells during the mitotic
phase as well. Membrane bound Spike protein might be attacked by
antibodies leading to antibody dependent cell-mediated cytotoxicity
(ADCC).
Figure 7
MHC class I peptide antigen presentation illustrated on the left: MHC
class I peptide presentation to CD8 positive cytotoxic T-cells. Note,
Corona viruses are taken up by ACE2 positive cells, adenoviruses by CAR
and LNP mRNA vaccines by apolipoprotein E. Note, peptides presented by
MHC class I complexes are of cytosolic origin. Adenoviral DNA will end
up in the nucleus. Possibly, DNA fragments of DNA contaminated mRNA
vaccines might enter the nucleus of dividing cells during the mitotic
phase as well. Membrane bound Spike protein might be attacked by
antibodies leading to antibody dependent cell-mediated cytotoxicity
(ADCC).
MHC class II peptide presentation by B-cells illustrated on the right:
Peptides are derived from antigens that have initially been engulfed in
B-cells by membrane bound monomeric IgM (note, endothelial cells and
antigen-presenting cells (APC) do not express monomeric IgM antibodies
on their cell surface). Usually, B-cells require cytokines secreted by
CD4 positive helper T-cells to induce IgM production,
Activation-Induced Cytidine Deaminase (AID) mediated IG class switching
and differentiation of antibody secreting plasma cells.
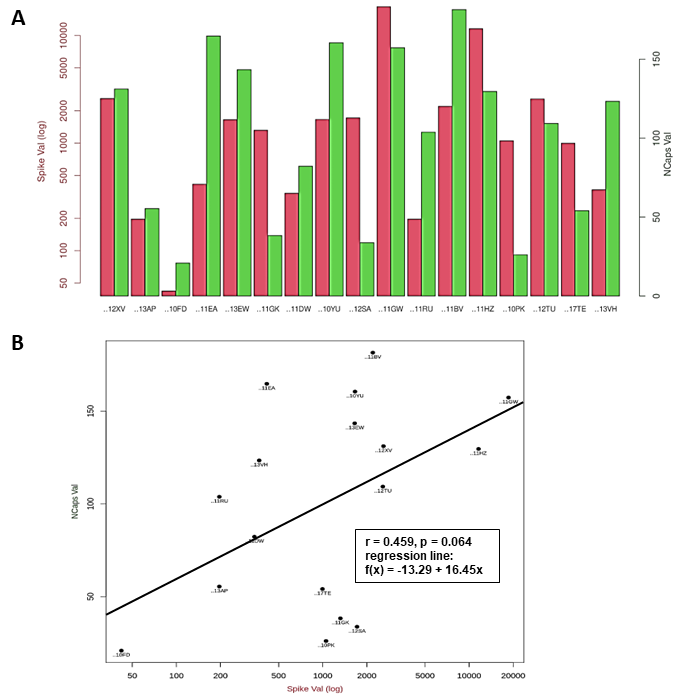 Figure 8
Vaccination study of healthcare workers.
Figure 8
Vaccination study of healthcare workers.
A The antibody titers specific to SARS-CoV-2 Spike protein are
listed on the left (red bars), the antibody titers specific to
SARS-CoV-2 NCapsid are listed on the right (green bars) for 17 donors.
Values are given in logarithmic scaling. Donor IDs are listed at the
bottom.
B Regression Analysis: NCapsid antibody titers are listed at
the y-axis, antibody titers regarding the Spike protein are listed at
the x-axis. Parameters of the regression analysis are given in the box.
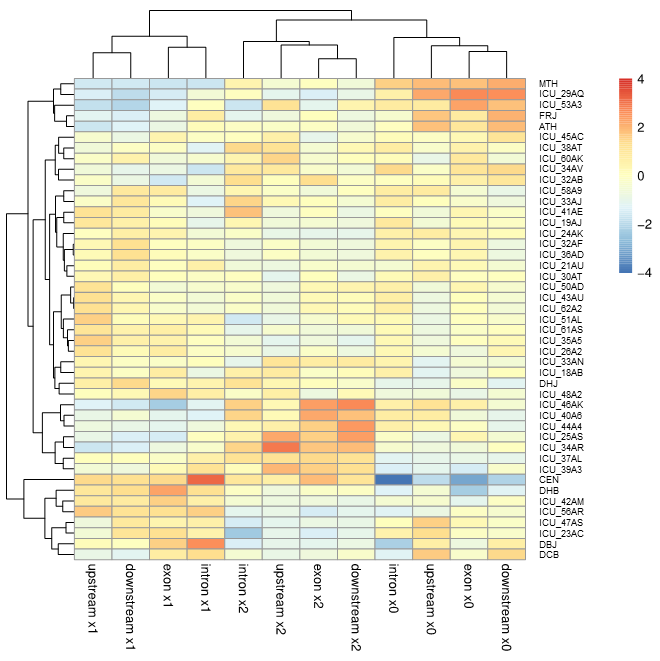 Figure 9
Outlier-analysis of CEN: A longevity-related gene-set based on 37 whole
genome sequenced ICU patients, 7 healthy Europeans and one 111 years
old healthy female (CEN). The dendrogram regarding the genome IDs
(right side) is shown on the left. Segments of dissected gene
structures (see also Figure 3) are listed at the bottom, corresponding
dendrograms at the top. Please, note SNPs being heterozygous (X1),
homozygous protective (X0) and disease associated (X2) classify
together.
Figure 9
Outlier-analysis of CEN: A longevity-related gene-set based on 37 whole
genome sequenced ICU patients, 7 healthy Europeans and one 111 years
old healthy female (CEN). The dendrogram regarding the genome IDs
(right side) is shown on the left. Segments of dissected gene
structures (see also Figure 3) are listed at the bottom, corresponding
dendrograms at the top. Please, note SNPs being heterozygous (X1),
homozygous protective (X0) and disease associated (X2) classify
together.
 Figure 10
Undirected Graph Presentation: Network diagram visualizing the
relationships of 51 individuals: 44 healthy Europeans (light blue), 6
ICU patients (yellow), and 1 CEN (green) based on the disease values of
50 SNPs. The graphs determine which genomes (nodes) are preferentially
connected with each other using the 3 highest SNP values that each SNP
shares with the 51 genomes selected. The SNP disease values define the
connections between the individuals regarding their top three entries.
The abundance of SNP connections between two genomes is illustrated by
the thickness of the connecting graph. Individuals not connected to
others are given at the right. Interestingly, the ICU patients are
directly connected with each other coined ICU-32AB, ICU_44A4 and
ICU_53A3. Genome NA12045 is linked with the ICU genome ICU_44A4, see
also the animation of NA12045 in Figure 2.
Figure 10
Undirected Graph Presentation: Network diagram visualizing the
relationships of 51 individuals: 44 healthy Europeans (light blue), 6
ICU patients (yellow), and 1 CEN (green) based on the disease values of
50 SNPs. The graphs determine which genomes (nodes) are preferentially
connected with each other using the 3 highest SNP values that each SNP
shares with the 51 genomes selected. The SNP disease values define the
connections between the individuals regarding their top three entries.
The abundance of SNP connections between two genomes is illustrated by
the thickness of the connecting graph. Individuals not connected to
others are given at the right. Interestingly, the ICU patients are
directly connected with each other coined ICU-32AB, ICU_44A4 and
ICU_53A3. Genome NA12045 is linked with the ICU genome ICU_44A4, see
also the animation of NA12045 in Figure 2.
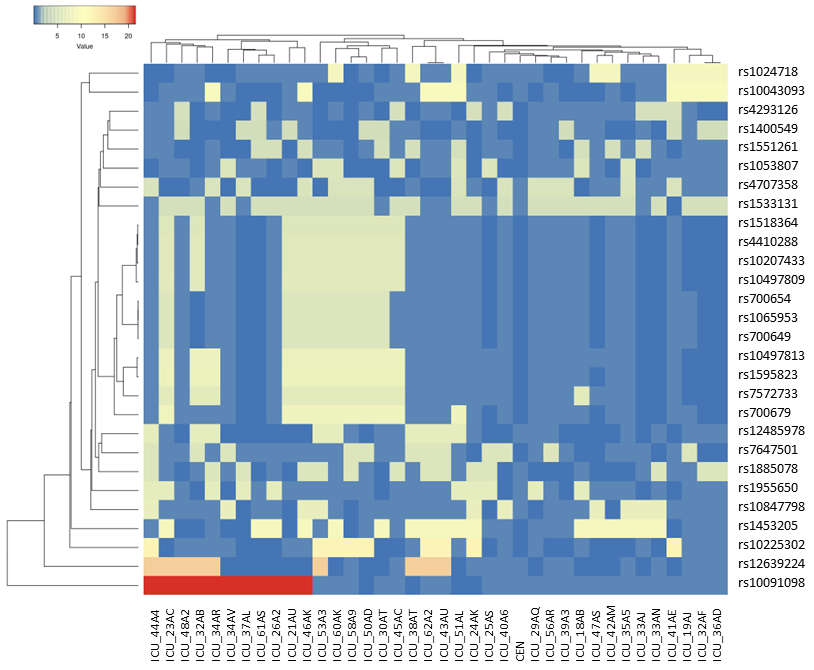 Figure 11
Heatmap and clustering of 28 selected SNPs (nominator CEN: fH and P) to
compare SNP data sets stratifying 37 ICU patients with the 111 years
old female (CEN). Average Linkage and Euclidean distance measurement
model was used. Note, unfortunately, we do not know how CEN would have
managed to cope with a SARS-CoV2 infections. As such, her genome is
taken as an outlier and as a surrogate in SARS-CoV-2 host genome
studies. The principal concept becomes obvious. With this method, we
identify a bunch of SNPs in the midst of the heatmap that are shared by
7/8 ICU patients but not by CEN. We hypothesize that this strategy will
enable us to determine weighted factors to improve our prediction of
personal risk scores.
Figure 11
Heatmap and clustering of 28 selected SNPs (nominator CEN: fH and P) to
compare SNP data sets stratifying 37 ICU patients with the 111 years
old female (CEN). Average Linkage and Euclidean distance measurement
model was used. Note, unfortunately, we do not know how CEN would have
managed to cope with a SARS-CoV2 infections. As such, her genome is
taken as an outlier and as a surrogate in SARS-CoV-2 host genome
studies. The principal concept becomes obvious. With this method, we
identify a bunch of SNPs in the midst of the heatmap that are shared by
7/8 ICU patients but not by CEN. We hypothesize that this strategy will
enable us to determine weighted factors to improve our prediction of
personal risk scores.
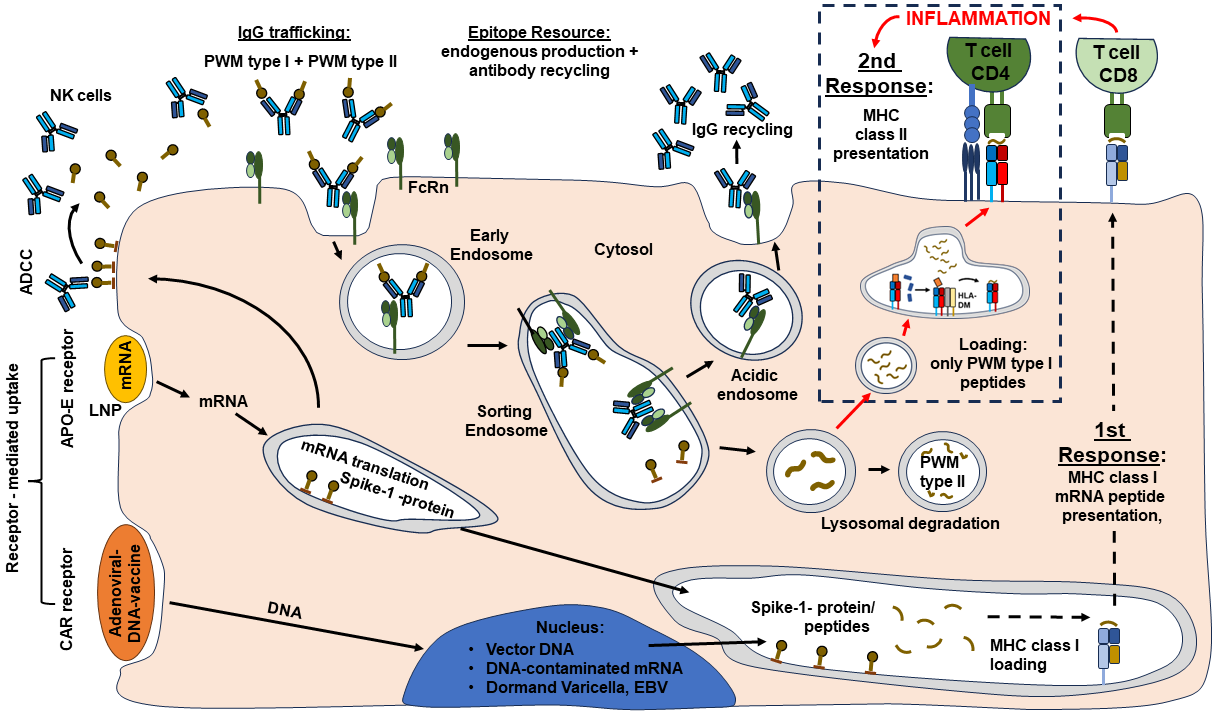 Figure 12
Hypothetical model regarding the pathophysiology of ME/CFS. The
illustration is an extension of Figure 7. The model is based on our
publication by Lustrek et al. 2013 and published expertise on IgG
trafficking [Blumberg et al. 2019; Pyzik et al. 2019; Schmidt et al.
2017; Patrick et al. 2023; Quigley et al. 2015]. Our ME/CFS model is
based on our understanding that Covid-19 is a polygenic disease, but
the pathophysiology of ME/CFS is autoimmune mediated and the disease
process is most likely dependent on a confounder, a second trigger
(Herpes virus or EBV expression, long-term expression of Corona Spike
protein, remaining LNP residues in the cell, integrated DNA plasmid
from DNA contaminated mRNA vaccines). Target cells (here endothelial
cell) are heavily involved in IgG trafficking of IgG and albumin. As
illustrated in the cartoon, the FcRn receptor takes IgG immunoglobulins
together with their cargo (Antigens /Peptides) into the Sorting
Endosomes. The immunoglobulins get re-cycled and the cargo peptides
become degraded. Noteworthy, endothelial cells are in principle MHC
class II negative. If these cells get in contact with cationic LNPs
(LNPs encoded mRNA vaccines), inflammatory processes are expected to be
induced followed by cellular infiltration.
Figure 12
Hypothetical model regarding the pathophysiology of ME/CFS. The
illustration is an extension of Figure 7. The model is based on our
publication by Lustrek et al. 2013 and published expertise on IgG
trafficking [Blumberg et al. 2019; Pyzik et al. 2019; Schmidt et al.
2017; Patrick et al. 2023; Quigley et al. 2015]. Our ME/CFS model is
based on our understanding that Covid-19 is a polygenic disease, but
the pathophysiology of ME/CFS is autoimmune mediated and the disease
process is most likely dependent on a confounder, a second trigger
(Herpes virus or EBV expression, long-term expression of Corona Spike
protein, remaining LNP residues in the cell, integrated DNA plasmid
from DNA contaminated mRNA vaccines). Target cells (here endothelial
cell) are heavily involved in IgG trafficking of IgG and albumin. As
illustrated in the cartoon, the FcRn receptor takes IgG immunoglobulins
together with their cargo (Antigens /Peptides) into the Sorting
Endosomes. The immunoglobulins get re-cycled and the cargo peptides
become degraded. Noteworthy, endothelial cells are in principle MHC
class II negative. If these cells get in contact with cationic LNPs
(LNPs encoded mRNA vaccines), inflammatory processes are expected to be
induced followed by cellular infiltration.
Most likely, the expression of MHC class II complexes will be induced
in these endothelial cells as well. Suddenly, the cargo peptides do not
get degraded anymore, but they are expected to be presented to CD4
T-cells. Simultaneously, CD8 T-cells might attack the infected and/or
vaccinated endothelial cells. In addition, endogenous viral proteins
might get activated, or they were already reactivated before. Note,
inflamed tissues do express APO-E, a target for uptake of LNP-coated
mRNA vaccines. Tissues/cells with high proliferation indices do more
easily integrate DNA in their genome.
In summary, the ME/CFS model presented is based on a two-step
procedure. Step I: activation of CD8 cells, Step II: the activation of
MHC class II peptide presentation of peptides that are delivered via
the IgG trafficking. Our model distinguishes between PWM type I and PWM
type II peptides [Lustrek et al 2013]. PWM type I peptides are supposed
to enhance the inflammatory process (second response), PWM type II
peptides should be degraded instead.
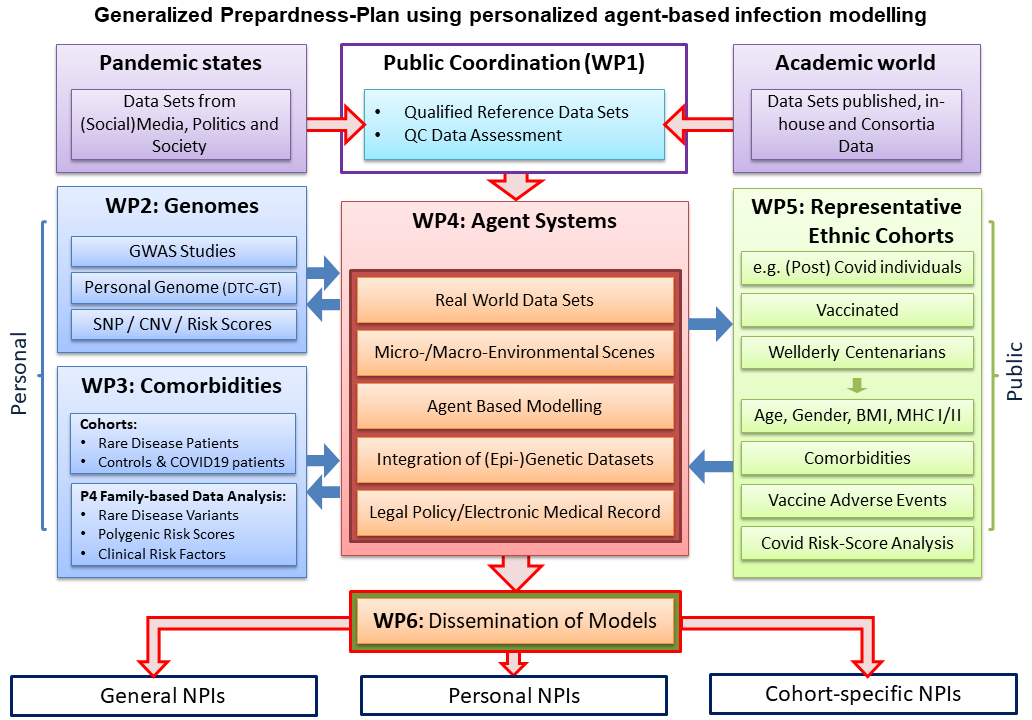 Figure 13
Generalized Preparedness-Plan using personalized agent-based infection modelling.
Figure 13
Generalized Preparedness-Plan using personalized agent-based infection modelling.
The preparedness plan is a result of communications that Prof. Thiesen
experienced as actor /scientific expert with healthcare providers on
local, regional and national levels and as follower of public and
social media [Thiesen: Auswertung des Corona-Impf-Checkers; Thiesen:
Ausschussdrucksache Deutscher Bundestag]. One prominent event, worth
mentioning, was the talk show held by Markus Lanz on April 2nd, 2020,
illustrating how in Mecklenburg-Western Pomerania experts gave advice
to local political authorities [Zweites Deutsches Fernsehen: Markus Lanz].
As experienced by medical colleagues [Kremer et al. 2020], the strong age dependency of
Covid-19 deaths was completely ignored in public and social media. As
outlined by Glocker et al. on the preprint surfer [Glocker et al. 2021
Dec 15] and being published February 2nd, 2022 [Glocker et al. 2022 Feb
2], the shift from SARS-CoV-2 Delta to Omicron has been coined
Babylonian Confusion. The Preparedness-Plan presented integrates
experiences experts have made during the pandemic. The IndyMed
Preparedness-Plan as presented led to tailor-made NPI measures
regarding forthcoming pandemics. Unlike one-size-fits-all approaches,
tailor-made plans include local factors such as cultural practices,
community structures, resource availability, local health
infrastructure, and specific epidemiological data in addition to
detailed knowledge on impact comorbidities might have in respect to
regional geographic and demographic details of a population e.g.
countryside vs. metropolitan area. A democracy having such a
preparedness plan would never have coined an expression such as
Covidiots.
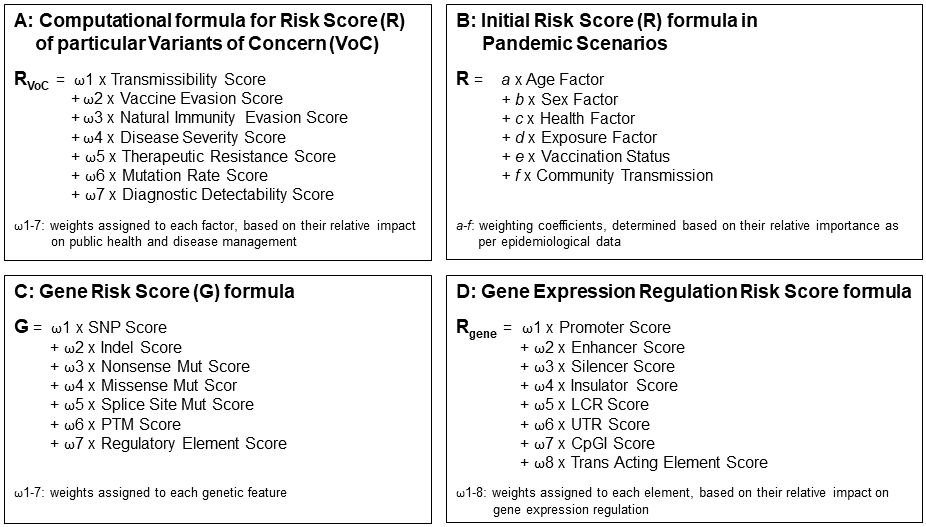 Figure 14
Risk score formulas presented cover four viewpoints:
Figure 14
Risk score formulas presented cover four viewpoints:
A The risk of viral Variants of Concern that touches everyone whether putative victim
or healthcare provider.
B Initial risks healthcare providers ought to
protect a society from.
C The risk in case, a pandemic severely hits
only a selected subgroup within a population, medical societies are
called to be in charge of determining causal reasons e.g. that might
determine the severity of an infection. SNP data bases are available to
assess the diversity of protein structure functions within a
population.
D Risk determination of altered regulation of gene
expression. Here, we do not have databases that can be immediately
used.
The beauty of this illustration: Experts might be encouraged to adjust
the weighted factors of the individual sub-parameter mentioned, plus
extend the number of sub-parameters as well - On the way to a
real-world roadmap.